

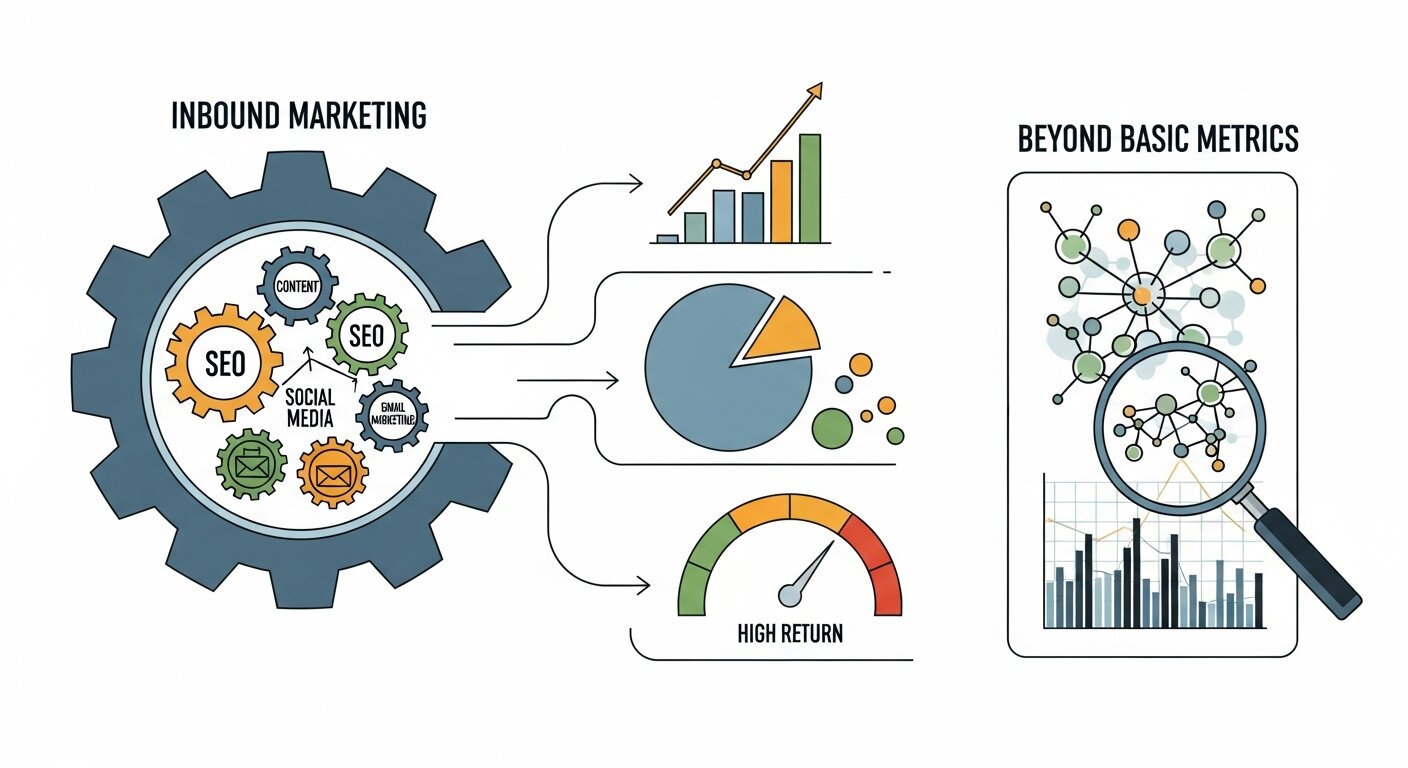
Effective inbound marketing ROI measurement moves beyond vanity metrics to focus on revenue attribution, customer acquisition cost, lifetime value, lead quality, conversion optimization, channel performance, and pipeline velocity.
Measuring inbound marketing ROI goes far beyond tracking page views, click-through rates, or social media followers. While these traditional metrics offer a snapshot of activity, they rarely reveal whether your marketing efforts are truly driving business growth. Inbound marketing operates through multiple touchpoints, long nurturing cycles, and value-driven engagement, making attribution and performance measurement more complex than ever.
This guide explores how to evaluate inbound marketing ROI with metrics that matter—metrics that connect your campaigns to revenue, customer acquisition, and long-term growth. From advanced attribution models and customer lifetime value analysis to content engagement and pipeline velocity, you’ll learn how to shift from vanity metrics to actionable insights that demonstrate real business impact.
Measuring Inbound Marketing ROI: Beyond Basic Metrics That Actually Matter
Most marketing teams track page views, click-through rates, and social media followers. They celebrate when traffic spikes and panic when engagement dips. But here’s the uncomfortable truth: none of these metrics tell you whether your inbound marketing strategy is actually working.
The problem isn’t that marketers lack data. They’re drowning in it. Google Analytics dashboards overflow with charts and graphs. Social media platforms serve up endless engagement statistics. Email marketing tools report open rates down to the decimal point. Yet when leadership asks about return on investment, many marketers struggle to connect these vanity metrics to actual business outcomes.
Measuring inbound marketing ROI requires a fundamental shift in perspective. Instead of counting impressions and clicks, successful marketers focus on metrics that directly correlate with revenue, customer lifetime value, and sustainable growth. They track how content moves prospects through the buyer’s journey. They measure the quality of leads generated, not just the quantity. They understand which channels and campaigns contribute to closed deals.
This comprehensive guide explores the metrics that actually matter when evaluating inbound marketing performance. You’ll learn how to move beyond surface-level analytics, establish meaningful benchmarks, and build a measurement framework that demonstrates real business value. Whether you’re justifying budget allocation or optimizing campaign performance, these strategies will help you measure what truly drives results.
Why Traditional Metrics Fall Short
Marketing has inherited measurement frameworks from advertising’s broadcast era. Impressions, reach, and frequency made sense when companies paid for billboard space and television commercials. These metrics answered a simple question: how many people saw our message?
Inbound marketing operates differently. It attracts prospects through valuable content, builds relationships over time, and nurtures leads until they’re ready to buy. This approach creates multiple touchpoints across various channels throughout an extended sales cycle. A single customer might discover your brand through organic search, subscribe to your newsletter, download three whitepapers, attend a webinar, and request a demo before making a purchase decision.
Traditional metrics can’t capture this complexity. Website traffic tells you how many visitors arrived, but not whether they were qualified prospects. Email open rates indicate curiosity, but not genuine interest. Social media followers suggest brand awareness, but not purchase intent.
These vanity metrics become particularly problematic when teams optimize for the wrong outcomes. Marketers chase viral content that generates thousands of shares but attracts the wrong audience. They focus on growing email lists without considering subscriber quality. They celebrate traffic increases while conversion rates decline.
Revenue-focused measurement requires different thinking. Instead of asking “how many people saw this?”, effective marketers ask “did this contribute to revenue growth?” This question demands metrics that connect marketing activities to business outcomes.
The Complete Framework for Inbound Marketing ROI
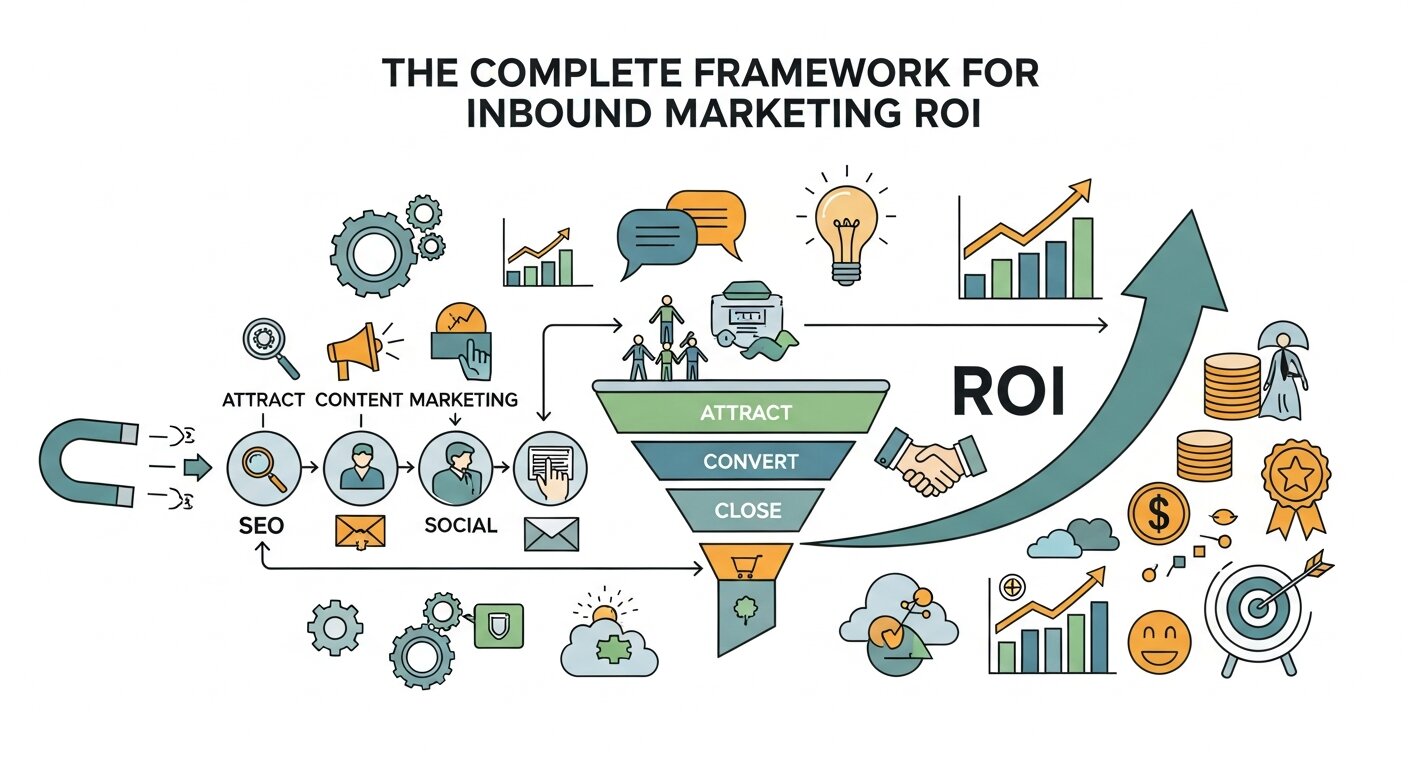
Calculating inbound marketing ROI starts with a deceptively simple formula: (Revenue Generated – Marketing Investment) / Marketing Investment × 100. A campaign that costs $10,000 and generates $50,000 in revenue delivers a 400% ROI. But determining which revenue to attribute to which marketing activities requires sophisticated measurement systems.
Attribution modeling forms the foundation of accurate ROI calculation. First-touch attribution credits the initial interaction that brought a prospect into your ecosystem. Last-touch attribution assigns value to the final touchpoint before conversion. Multi-touch attribution distributes credit across all interactions throughout the buyer’s journey.
Each model offers different insights. First-touch attribution helps you understand which channels effectively attract new prospects. Last-touch attribution reveals what finally convinces leads to convert. Multi-touch attribution provides the most comprehensive view by acknowledging that multiple interactions contribute to purchase decisions.
Time lag introduces additional complexity. B2B sales cycles often span months or years. A prospect might download an ebook in January, engage with nurture emails through spring, attend a conference in summer, and close in autumn. Accurate ROI measurement requires tracking these extended journeys and attributing revenue to the right marketing touchpoints.
Marketing investment extends beyond advertising spend. Comprehensive calculation includes content creation costs, technology platforms, staff salaries, agency fees, and overhead allocation. Many teams underestimate true marketing costs and overestimate ROI as a result.
Revenue attribution becomes more straightforward when marketing and sales teams align around shared definitions. Clearly define what constitutes a marketing-qualified lead versus a sales-qualified lead. Establish service level agreements about lead follow-up timing. Implement closed-loop reporting that tracks leads from first touch through closed deal.
Customer Acquisition Cost and Lifetime Value
Customer acquisition cost (CAC) measures how much you spend to acquire each new customer. Calculate it by dividing total marketing and sales expenses by the number of customers acquired during a specific period. If you spend $100,000 on marketing and sales in a quarter and acquire 50 customers, your CAC is $2,000.
This metric becomes powerful when compared across channels, campaigns, and customer segments. You might discover that content marketing delivers a CAC of $1,500 while paid advertising costs $3,000 per customer. Or that enterprise customers cost more to acquire but generate significantly higher lifetime value.
Customer lifetime value (CLV) predicts the total revenue a customer will generate throughout their relationship with your company. Basic CLV calculation multiplies average purchase value by purchase frequency and customer lifespan. More sophisticated models account for profit margins, discount rates, and churn probability.
The ratio between CLV and CAC determines business viability. A healthy SaaS business typically targets a CLV:CAC ratio of 3:1 or higher. Ratios below 1:1 indicate unsustainable unit economics. Ratios above 5:1 might suggest underinvestment in growth.
Inbound marketing typically delivers superior CAC compared to outbound tactics. SEO and content marketing require significant upfront investment but generate compounding returns over time. A single blog post can attract qualified leads for years after publication. A well-optimized webpage continues driving organic traffic without ongoing ad spend.
Payback period—the time required to recover customer acquisition costs—provides another critical benchmark. Subscription businesses often aim for CAC payback within 12 months. Faster payback periods improve cash flow and enable more aggressive growth investment.
Content Performance Beyond Page Views
Traffic volume tells you nothing about content quality. A viral listicle might generate 100,000 pageviews from casual browsers who never return. A technical whitepaper might attract only 500 visitors but convert 50 enterprise leads. Effective content measurement focuses on engagement depth and conversion impact rather than surface-level traffic.
Time on page offers initial engagement signals. Visitors who spend 30 seconds on a 2,000-word article clearly didn’t read it. Those who spend six minutes likely consumed most of the content. But time-based metrics have limitations—someone might open your article in a browser tab and forget about it for an hour.
Scroll depth tracking reveals actual consumption patterns. If 80% of visitors scroll to the bottom of your article, you’ve created compelling content. If most abandon after the first paragraph, something isn’t working.
Engagement rate combines multiple signals into a composite metric. It might include scroll depth, time on page, internal link clicks, video plays, and social shares. This multidimensional view provides richer insight than any single metric.
Conversion rate measures how effectively content drives desired actions. For top-of-funnel content, conversions might include email subscriptions or content downloads. Middle-of-funnel content should generate demo requests or consultation bookings. Bottom-of-funnel content should contribute directly to sales.
Creating content clusters improves both user experience and SEO performance. Build comprehensive pillar pages around core topics, then create supporting cluster content that explores specific aspects in detail. Link cluster content back to the pillar page. This structure helps search engines understand topical authority and keeps visitors engaged with related content.
Return visitor rate indicates whether content builds lasting relationships. One-time visitors might find individual articles useful, but returning visitors demonstrate genuine interest in your brand. High return rates suggest effective content strategy and audience fit.
Content atomization extends the value of substantial content pieces. Transform a comprehensive research report into blog posts, infographics, social media posts, podcast episodes, and video content. This approach maximizes investment while reaching audiences across different channels and consumption preferences.
Lead Quality and Conversion Optimization
Lead volume matters less than lead quality. Generating 1,000 unqualified leads wastes sales team time and damages conversion rates. Attracting 100 high-intent prospects who match your ideal customer profile delivers far better results.
Lead scoring systems assign point values based on demographic fit and behavioral signals. A vice president at a Fortune 500 company might receive more points than a student. Someone who visits your pricing page and requests a demo shows higher intent than someone who read a single blog post.
Marketing-qualified leads (MQLs) meet minimum criteria for sales engagement. They’ve demonstrated sufficient interest and fit your target customer profile. Sales-qualified leads (SQLs) have been vetted by sales teams and deemed worthy of active pursuit. Tracking MQL-to-SQL conversion rates reveals whether marketing attracts the right prospects.
Lead velocity rate measures growth in qualified leads month over month. This forward-looking metric predicts future revenue more reliably than lagging indicators like closed deals. Consistent lead velocity growth suggests healthy pipeline development.
Conversion rate optimization focuses on removing friction throughout the buyer’s journey. A/B testing identifies which headlines, images, form fields, and calls-to-action drive better results. Multivariate testing explores how different combinations of elements perform together.
Landing page conversion rates vary dramatically by industry, traffic source, and offer type. B2B landing pages often convert between 2% and 5%. Higher conversion rates might indicate strong offer-audience fit, while lower rates suggest messaging misalignment or technical problems.
Form abandonment analysis reveals where prospects lose interest. Do visitors start filling out forms but give up halfway through? Perhaps you’re asking for too much information too early. Heat mapping tools show where visitors click, scroll, and get stuck.
Channel Attribution and Performance
Multi-channel attribution distributes credit across all touchpoints that contribute to conversion. A prospect might discover your brand through organic search, return via social media, engage with an email campaign, and convert after clicking a retargeting ad. Each touchpoint deserves appropriate credit.
Data-driven attribution uses machine learning to analyze conversion paths and assign value based on statistical analysis rather than arbitrary rules. This approach adapts to your specific customer journeys and provides more accurate insight than position-based models.
Organic search typically delivers the highest long-term ROI for inbound marketing. Initial investment in content creation and SEO yields compounding returns as content ranks for relevant keywords and attracts ongoing traffic. Track organic traffic growth, keyword rankings, and organic-sourced conversions.
Email marketing remains one of the most cost-effective channels. But open rates and click-through rates don’t tell the complete story. Measure email-attributed revenue, subscription growth rate, and engagement trends over time. Segment analysis reveals which subscriber groups generate the most value.
Social media metrics should focus on community building and traffic quality rather than vanity metrics. Track referral traffic from social channels, social-sourced conversions, and audience growth among target demographics. Engagement rates matter more than follower counts.
Referral traffic quality varies significantly by source. A mention on an industry-leading publication might send highly qualified prospects. A link from a content farm might generate traffic that immediately bounces. Analyze traffic by referring domain to understand which relationships deserve cultivation.
Direct traffic often indicates strong brand awareness. Visitors who type your URL directly into browsers or use bookmarks already know your company. Growth in direct traffic suggests effective brand building.
Pipeline Velocity and Sales Cycle Metrics
Pipeline velocity measures how quickly deals move from lead to closed customer. Calculate it by multiplying the number of opportunities by average deal value and win rate, then dividing by sales cycle length. Faster pipeline velocity generates more revenue with the same lead volume.
Sales cycle length tracking reveals how inbound marketing impacts buying timelines. Prospects who engage with educational content often research more thoroughly before initiating contact. They arrive better informed and may move through sales conversations faster than cold leads.
Win rate represents the percentage of opportunities that close successfully. Inbound leads typically convert at higher rates than outbound prospects because they’ve self-qualified through content engagement. Track win rates by lead source to identify which channels produce the best customers.
Deal size analysis shows whether inbound marketing attracts enterprise customers, small businesses, or a mix. Some content naturally appeals to specific company sizes. Whitepaper-heavy strategies might attract larger organizations, while self-service product content resonates with smaller companies.
Opportunity-to-customer conversion rate measures how effectively sales teams close qualified leads. Low conversion rates might indicate lead quality problems, misalignment between marketing and sales, or ineffective sales processes.
Sales qualified lead velocity predicts future revenue growth. If you’re generating 20% more SQLs each quarter, revenue should follow a similar trajectory (accounting for sales cycle lag).
Cost Per Acquisition Across Channels
Channel-specific cost per acquisition reveals which tactics deliver the best return. Organic search often provides the lowest CPA once content gains traction. Paid advertising usually costs more per acquisition but scales faster. Email marketing typically falls somewhere in between.
Content marketing CPA calculations must account for production costs and time lag. A comprehensive guide might cost $5,000 to produce and generate leads over two years. Divide total costs by all attributed conversions to determine true CPA.
SEO investment delivers declining CPA over time. Initial months require significant effort with minimal return. As content ranks and attracts traffic, the same investment generates more conversions. Year-over-year CPA comparisons demonstrate this compounding value.
Paid advertising CPA remains relatively stable but responds to competition and platform changes. Monitor CPA trends to identify when campaigns lose efficiency. Rising CPA might indicate ad fatigue, increased competition, or audience saturation.
Event marketing typically carries high CPA but facilitates multiple touchpoints. Conference sponsorship might cost $50,000 and directly generate 50 leads ($1,000 CPA). But those contacts often require extensive follow-up nurturing before conversion.
Partnership and co-marketing initiatives should be evaluated on CPA alongside relationship value. A co-hosted webinar might generate leads at $200 CPA while strengthening a strategic relationship that creates additional opportunities.
Revenue Attribution Models Compared
|
Attribution Model |
Best For |
Advantages |
Limitations |
|---|---|---|---|
|
First-Touch |
Understanding top-of-funnel effectiveness |
Simple to implement; shows acquisition channels |
Ignores nurturing impact |
|
Last-Touch |
Identifying conversion drivers |
Simple to calculate; highlights closing tactics |
Undervalues earlier touchpoints |
|
Linear |
Equal credit distribution |
Acknowledges all touchpoints; straightforward logic |
Oversimplifies complex journeys |
|
Time-Decay |
Emphasizing recent interactions |
Gives more credit to touchpoints near conversion |
Arbitrary decay rate selection |
|
Position-Based |
Balancing discovery and conversion |
Credits key moments in journey |
Requires defining which positions matter |
|
Data-Driven |
Complex, multi-touch journeys |
Uses actual conversion data; adapts over time |
Requires significant data volume |
Advanced Metrics for Sophisticated Marketers

Customer engagement score aggregates multiple behavioral signals into a single metric. It might combine email opens, content downloads, webinar attendance, website visits, and social media interactions. Highly engaged leads convert at higher rates and become better customers, which directly impacts Inbound Marketing ROI by improving conversion efficiency.
Net promoter score (NPS) measures customer satisfaction and loyalty. Customers who rate you 9 or 10 are promoters likely to refer others. Scores of 0-6 indicate detractors who might churn or damage your reputation. High NPS scores correlate with increased customer lifetime value and organic growth, strengthening Inbound Marketing ROI over time.
Content influence analyzes which content pieces contribute to closed deals. Tracking content engagement throughout the buyer’s journey reveals which assets move prospects toward purchase. These insights inform allocation of resources to maximize Inbound Marketing ROI by prioritizing high-impact content.
Share of voice compares your brand visibility to competitors across relevant channels. Higher share of voice typically correlates with market share. Track branded search volume, social mentions, and industry publication citations relative to competitors to understand your contribution to overall Inbound Marketing ROI.
Marketing sourced revenue represents deals where marketing played a significant role. Marketing influenced revenue includes any deal that had marketing touchpoints. Both of these metrics demonstrate marketing’s tangible contribution to business results and form the foundation for accurate Inbound Marketing ROI measurement.
Customer churn rate measures how many customers cancel or don’t renew. High churn undermines growth regardless of strong acquisition performance. Inbound marketing that sets accurate expectations tends to produce customers with lower churn, which enhances long-term Inbound Marketing ROI.
Expansion revenue tracks additional purchases from existing customers. When satisfied customers buy more products, upgrade subscriptions, or expand usage, they validate your marketing’s effectiveness and improve overall Inbound Marketing ROI by demonstrating the lasting value of inbound campaigns.
Building Your Measurement Infrastructure
Marketing analytics platforms connect data from multiple sources into unified dashboards. Tools like HubSpot, Marketo, and Salesforce provide integrated views of prospect journeys from first touch through closed deal. Custom dashboards surface the metrics that matter most to your business and provide actionable insight to improve Inbound Marketing ROI.
CRM integration ensures closed-loop reporting between marketing and sales. When sales teams update deal status, marketing platforms automatically attribute revenue to appropriate campaigns and channels. This connection is critical for understanding how specific actions contribute to Inbound Marketing ROI.
UTM parameters enable granular tracking of traffic sources. Adding campaign, source, medium, content, and term parameters to URLs helps you understand which specific initiatives drive results. Consistent naming conventions prevent data fragmentation and ensure accurate measurement of Inbound Marketing ROI.
Goal tracking in analytics platforms quantifies desired actions. Configure goals for newsletter signups, content downloads, demo requests, and purchases. Goal conversion rates reveal how effectively each channel drives outcomes that feed into Inbound Marketing ROI.
Custom event tracking captures interactions that standard analytics miss. Track video plays, scroll depth, button clicks, chat widget engagement, and tool usage. These signals provide richer context about visitor behavior, enabling teams to refine campaigns and maximize Inbound Marketing ROI.
Data cleanliness determines analysis quality. Deduplicate leads, standardize company names, validate email addresses, and filter bot traffic. Dirty data produces misleading insights and poor decisions, which can negatively impact Inbound Marketing ROI if not addressed.
Regular reporting cadences maintain accountability and visibility. Weekly dashboards might track leading indicators like lead volume and quality. Monthly reports could analyze conversion rates and CAC trends. Quarterly business reviews should examine ROI and strategic progress, tying all metrics back to Inbound Marketing ROI.
Taking Action on What Matters
Measuring Inbound Marketing ROI requires both technical infrastructure and strategic thinking. The metrics outlined in this guide connect marketing activities to business outcomes. They help you understand which channels acquire customers most efficiently, which content moves prospects toward purchase, and how marketing contributes to revenue growth.
Start by implementing closed-loop reporting between marketing and sales systems. Without this connection, accurate attribution and Inbound Marketing ROI calculation remain impossible. Establish clear definitions for lead qualification stages and service level agreements about lead handling. Build dashboards that surface metrics aligned with business objectives rather than vanity indicators.
Test different attribution models to understand how they affect channel evaluation. Multi-touch attribution provides the most complete picture but requires sophisticated analytics infrastructure. Simpler models offer valuable insights with less complexity. Choose an approach that matches your technical capabilities and sales cycle complexity to optimize Inbound Marketing ROI.
Most importantly, remember that measurement serves decision-making. Collect data that informs specific actions. If you can’t explain how a metric influences strategy, stop tracking it. Focus on metrics that reveal where to invest more, optimize, or cut losses, all with the goal of improving Inbound Marketing ROI.
Conclusion
Measuring Inbound Marketing ROI requires both strategic thinking and robust technical infrastructure. By focusing on metrics that align with business outcomes—such as lead quality, conversion rates, revenue attribution, and customer lifetime value—you can make data-driven decisions that optimize performance, improve resource allocation, and demonstrate marketing’s true value.
Inbound marketing is a long-term investment. Proper measurement ensures that each campaign, piece of content, and channel contributes meaningfully to growth. Organizations that adopt a holistic, revenue-focused approach to Inbound Marketing ROI not only justify their marketing spend but also gain a competitive edge by identifying and investing in the most impactful marketing strategies.
ntifying the strategies and touchpoints that drive sustainable results.
Frequently Asked Questions
What is a good inbound marketing ROI?
Most businesses target 5:1 ROI minimum, meaning $5 in revenue for every $1 invested in marketing. Exceptional performance reaches 10:1 or higher.
How long before inbound marketing shows ROI?
Initial results often appear within 3-6 months. Substantial ROI typically requires 6-12 months as content gains traction and rankings improve.
What’s the difference between MQL and SQL?
Marketing qualified leads meet basic criteria for sales engagement. Sales qualified leads have been vetted by sales teams and deemed worth pursuing actively.
How do you calculate customer acquisition cost?
Divide total marketing and sales expenses by the number of customers acquired during the same period.
What is customer lifetime value?
The total revenue a customer generates throughout their relationship with your company, accounting for repeat purchases and subscription renewals.
Why does attribution modeling matter?
Different attribution models assign value differently across touchpoints. Understanding attribution impacts budget allocation and channel evaluation.
What’s a healthy CLV to CAC ratio?
Most SaaS businesses target 3:1 or higher. Ratios below 1:1 indicate unsustainable unit economics.
How often should you review marketing metrics?
Monitor leading indicators weekly, analyze trends monthly, and conduct comprehensive reviews quarterly to adjust strategy based on performance.
What makes a lead high quality?
Quality leads match your ideal customer profile, demonstrate purchase intent through behavior, and have budget authority to make buying decisions.
Can you measure content marketing ROI accurately?
Yes, through conversion tracking, lead attribution, and revenue analysis. Track which content pieces influence closed deals throughout the buyer’s journey.
What is pipeline velocity?
The speed at which opportunities move from lead to closed customer, calculated by multiplying opportunities, deal value, and win rate, divided by sales cycle length.
How does inbound marketing affect sales cycle length?
Well-educated prospects often move faster through sales conversations because they’ve already researched solutions and understand their needs clearly.


